sparrowflight · excel

Excel is where data ends up.
So we taught Arrow Flight to speak Excel.
So we taught Arrow Flight to speak Excel.
Modern data infrastructure speaks Arrow. Analysts live in Excel. Between them:
CSV exports, copy-paste, and ODBC drivers that flatten columnar data through a
row-by-row straw. Nobody had a good Flight→Excel bridge — so we
built one.
Not a web add-in in a JavaScript sandbox. A native XLL —
a .NET Arrow Flight client running in-process inside Excel, marshaling record
batches straight into the grid.
Engine
Native XLL (Excel-DNA, .NET) — full gRPC/TLS from inside Excel, no sandbox, nothing else to install
Wire
Arrow Flight on :443 — record batches with IPC compression, 256 MB messages, through corporate firewalls
Into the grid
Arrow→cell marshaling — batches copied directly into spilled dynamic arrays; one formula, whole table
Async
Non-blocking functions + a batch queue — 200 formulas coalesce into one round-trip: 83,490 rows in 86 ms; Excel never freezes
Dialects
Any Flight server — swap the ticket-builder and the same client speaks to Dremio, InfluxDB 3, GizmoSQL, or a Sparrow snapshot. Already bilingual in production: EnergyScope Flight and Snowflake
one formula, ten years of data
=ES.Get("PET.RCLC1.D", "2016-01-01")
→ spills date + value columns into the grid. 8 ms from a local
snapshot, 27 ms across the LAN — the grid fills faster than a paste.
Fetch is the easy part.
A spreadsheet isn't a render target — it's a working document the analyst already
edited. ES.ColX writes a column the way an analyst would:
it reads what's in the sheet first, then touches only what changed, and says what
it did — in Excel's own visual language.
Nov-25
1,432.2
monthly actual
Dec-25
1,489.6
new this refresh — green border
Jan-26
1,455.3
revised — old value kept in a cell comment
Feb-26
1,470.8
synthesised from weeklies, until the monthly print lands
Mar-26
1,478.0
bold = analyst override — never overwritten
Apr-26
1,512.4
forecast periods, marked as such
Unchanged cells are skipped outright. Revisions keep the old number in a timestamped
comment — Before / Now. Bold cells belong to the analyst:
instead of overwriting, ColX notes the suppressed value in a comment. Missing months
are synthesised from weekly data (day-weighted, stock/flow aware) and automatically
superseded when the real print arrives. Optional extras mark structural
breakpoints and append forecast
periods — computed server-side, rendered as cells. The function returns the change
count and stamps the last data date under the formula, so a sheet of columns reads
as a morning dashboard: refresh, see what moved.
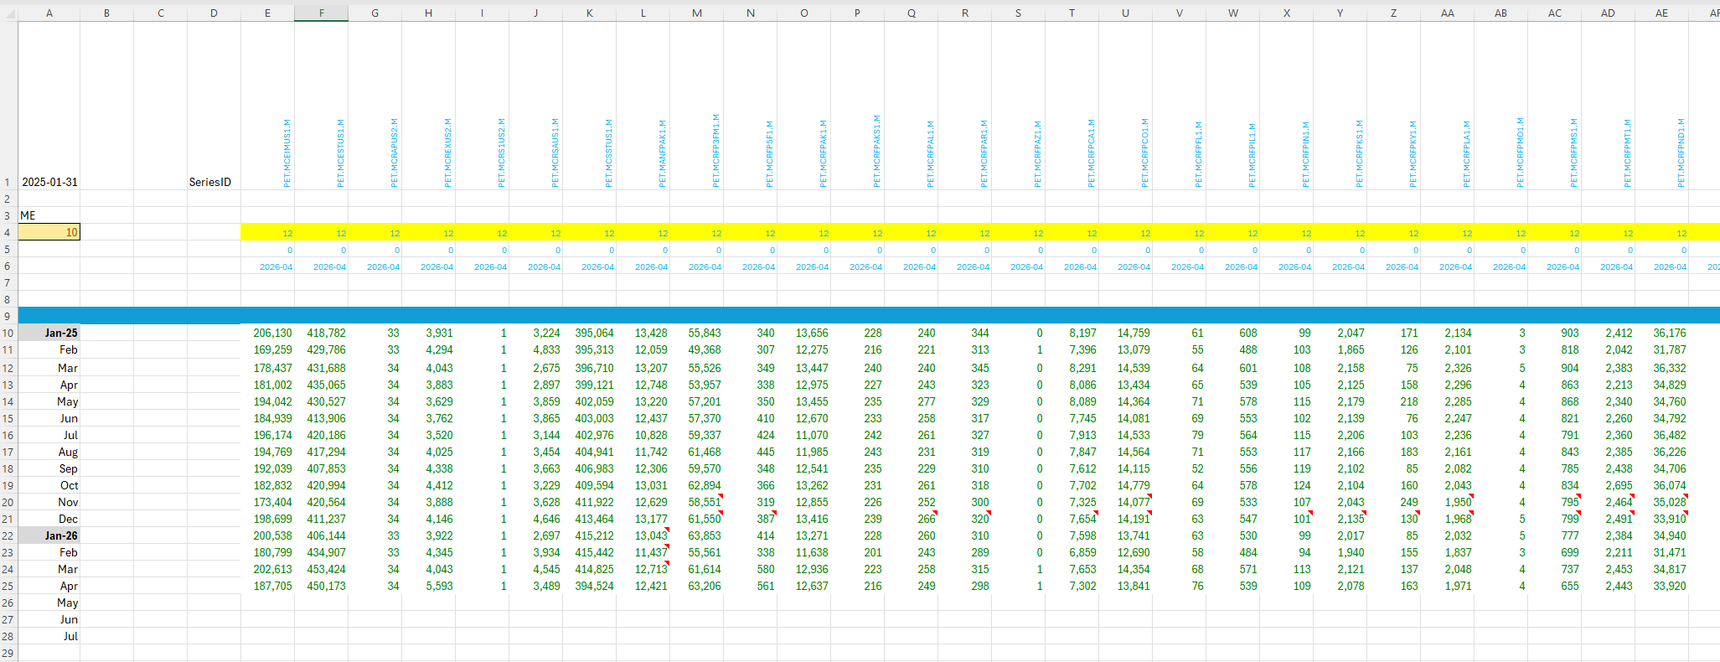
The real thing: a production supply-demand workbook, one ColX formula per column.
The yellow row counts changes since the last refresh; red corners are revisions carrying
their old value in the comment.
The proof is in production: the EnergyScope add-in ships 64
functions on this plumbing — data, forecasting, analytics — to energy-market users
today. The client underneath is domain-blind.
Want it against your own Flight server? sparrowXL ships
inside EnergyScope today; a standalone release is on the roadmap. If your data should
land in a grid like this, say hello —
it reaches me directly.
sparrowflight.io · 2026